
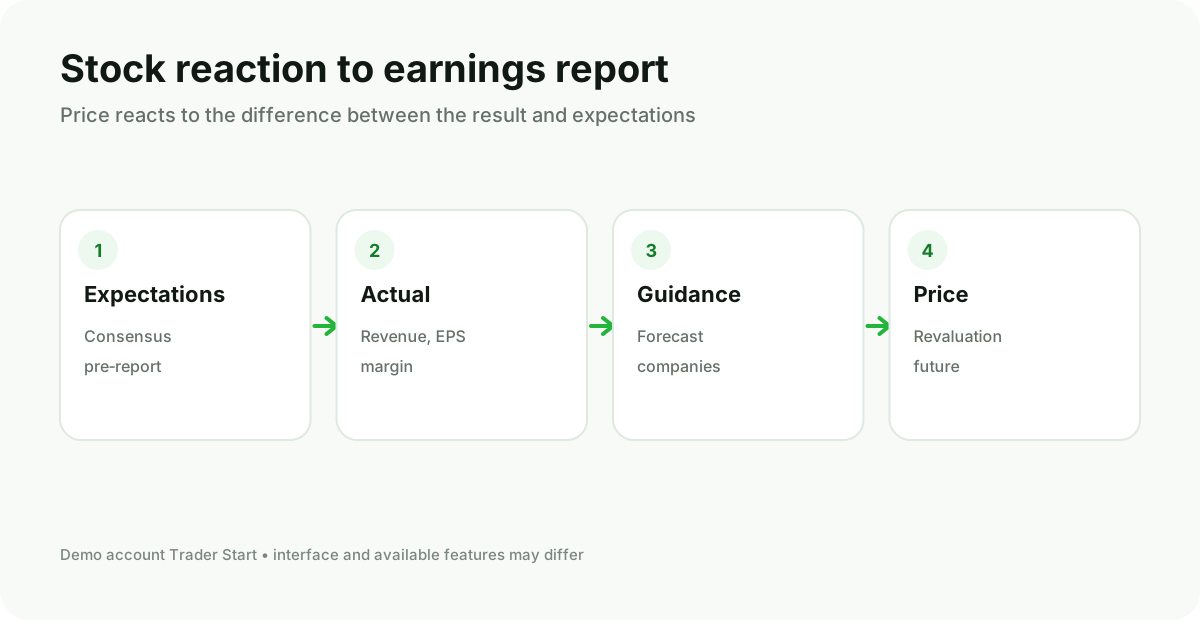
Key indicators
- Revenue — company sales volume;
- EPS / earnings per share — profit per share;
- gross and operating margin — business efficiency;
- Free Cash Flow — cash flow after capital expenditures;
- guidance / management outlook — company expectations for future periods.
Compare comparable periods
One figure is not enough. Look at year‑over‑year and quarter‑over‑quarter changes, organic growth, currency effects, one‑off items and segment structure. Different operating metrics matter for banks, manufacturers, SaaS companies and retail.
Why a stock can fall after a good earnings report
The results may be strong compared to last year, but weaker than inflated expectations. Pressure can also be caused by a cautious outlook, margin compression, rising expenses, weak cash flow, or management commentary on future demand.
The opposite scenario is also possible: the current quarter is weak, but the stock rises if the market expected worse or the company provided a convincing outlook.
Post‑release checklist
- Compare revenue and EPS to expectations.
- Check margin and cash flow.
- Read the outlook for the next quarter and year.
- Separate sustainable changes from one‑off factors.
- Look at the reaction of the stock, sector, and broad index.
- Listen to or read the key points of the conference call.
Next: why stocks move.