
Market and tokenomics
SOL market cap and supply
Current offer and market indicators are loaded separately from the trading chart.
Loading market indicators…
How to read the supply: “in circulation” — coins available to the market; “total minted” — current total supply; “maximum supply” — hard cap only where it is defined by the protocol or specified by the data provider.
Market capitalization, supply and reference-market metrics are loaded separately from the trading chart and are informational. The chart above uses broker Bid/Ask and execution through the cTrader Open API; the aggregator reference price below is not an execution quote.
Protocol and SOL inflation
SOL has no fixed maximum supply and no halving. The protocol follows an inflation schedule: the initial rate of 8% per year is set to decrease by 15% annually until reaching a long‑term level of 1.5%. The actual supply changes with issuance, fees, and network economics.
What is this asset
Native asset of the Solana network. Fees, staking and application operation on a high‑performance network.
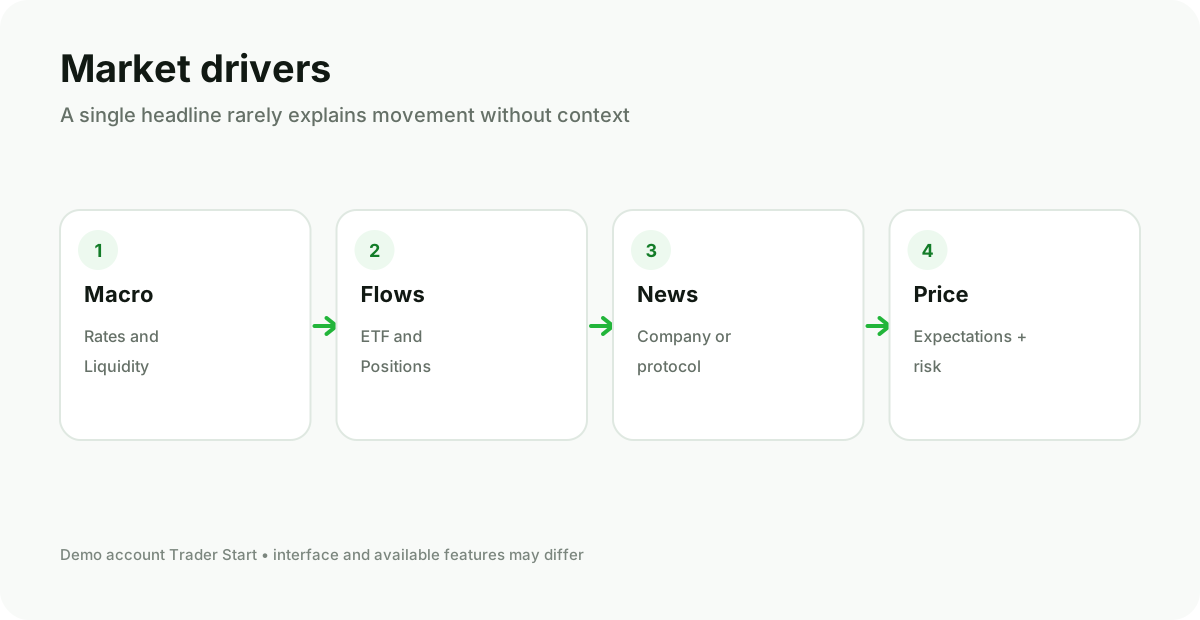
What influences the price
- Global liquidity, risk appetite and Bitcoin dynamics.
- Network usage, fees, developer and user activity.
- Coin supply, unlocks, staking and large flows.
- Regulation, listings, security and technical updates.
Key risks
Technical resilience, validators, ecosystem cycles, competition, and high volatility.
cTrader execution and the underlying crypto asset are not the same thing
The chart above uses the instrument supplied by the connected cTrader broker. Depending on the broker, this may be a CFD or another derivative rather than on-chain ownership of the coin. Before trading, check the contract specification, leverage, financing or swap, minimum volume and trading hours.