
Open TradingView alongside the guide
That way it’s easier to immediately find Supercharts, select the symbol source, and replicate the setup in your own workspace.
Basic access and paid features depend on the current TradingView conditions.
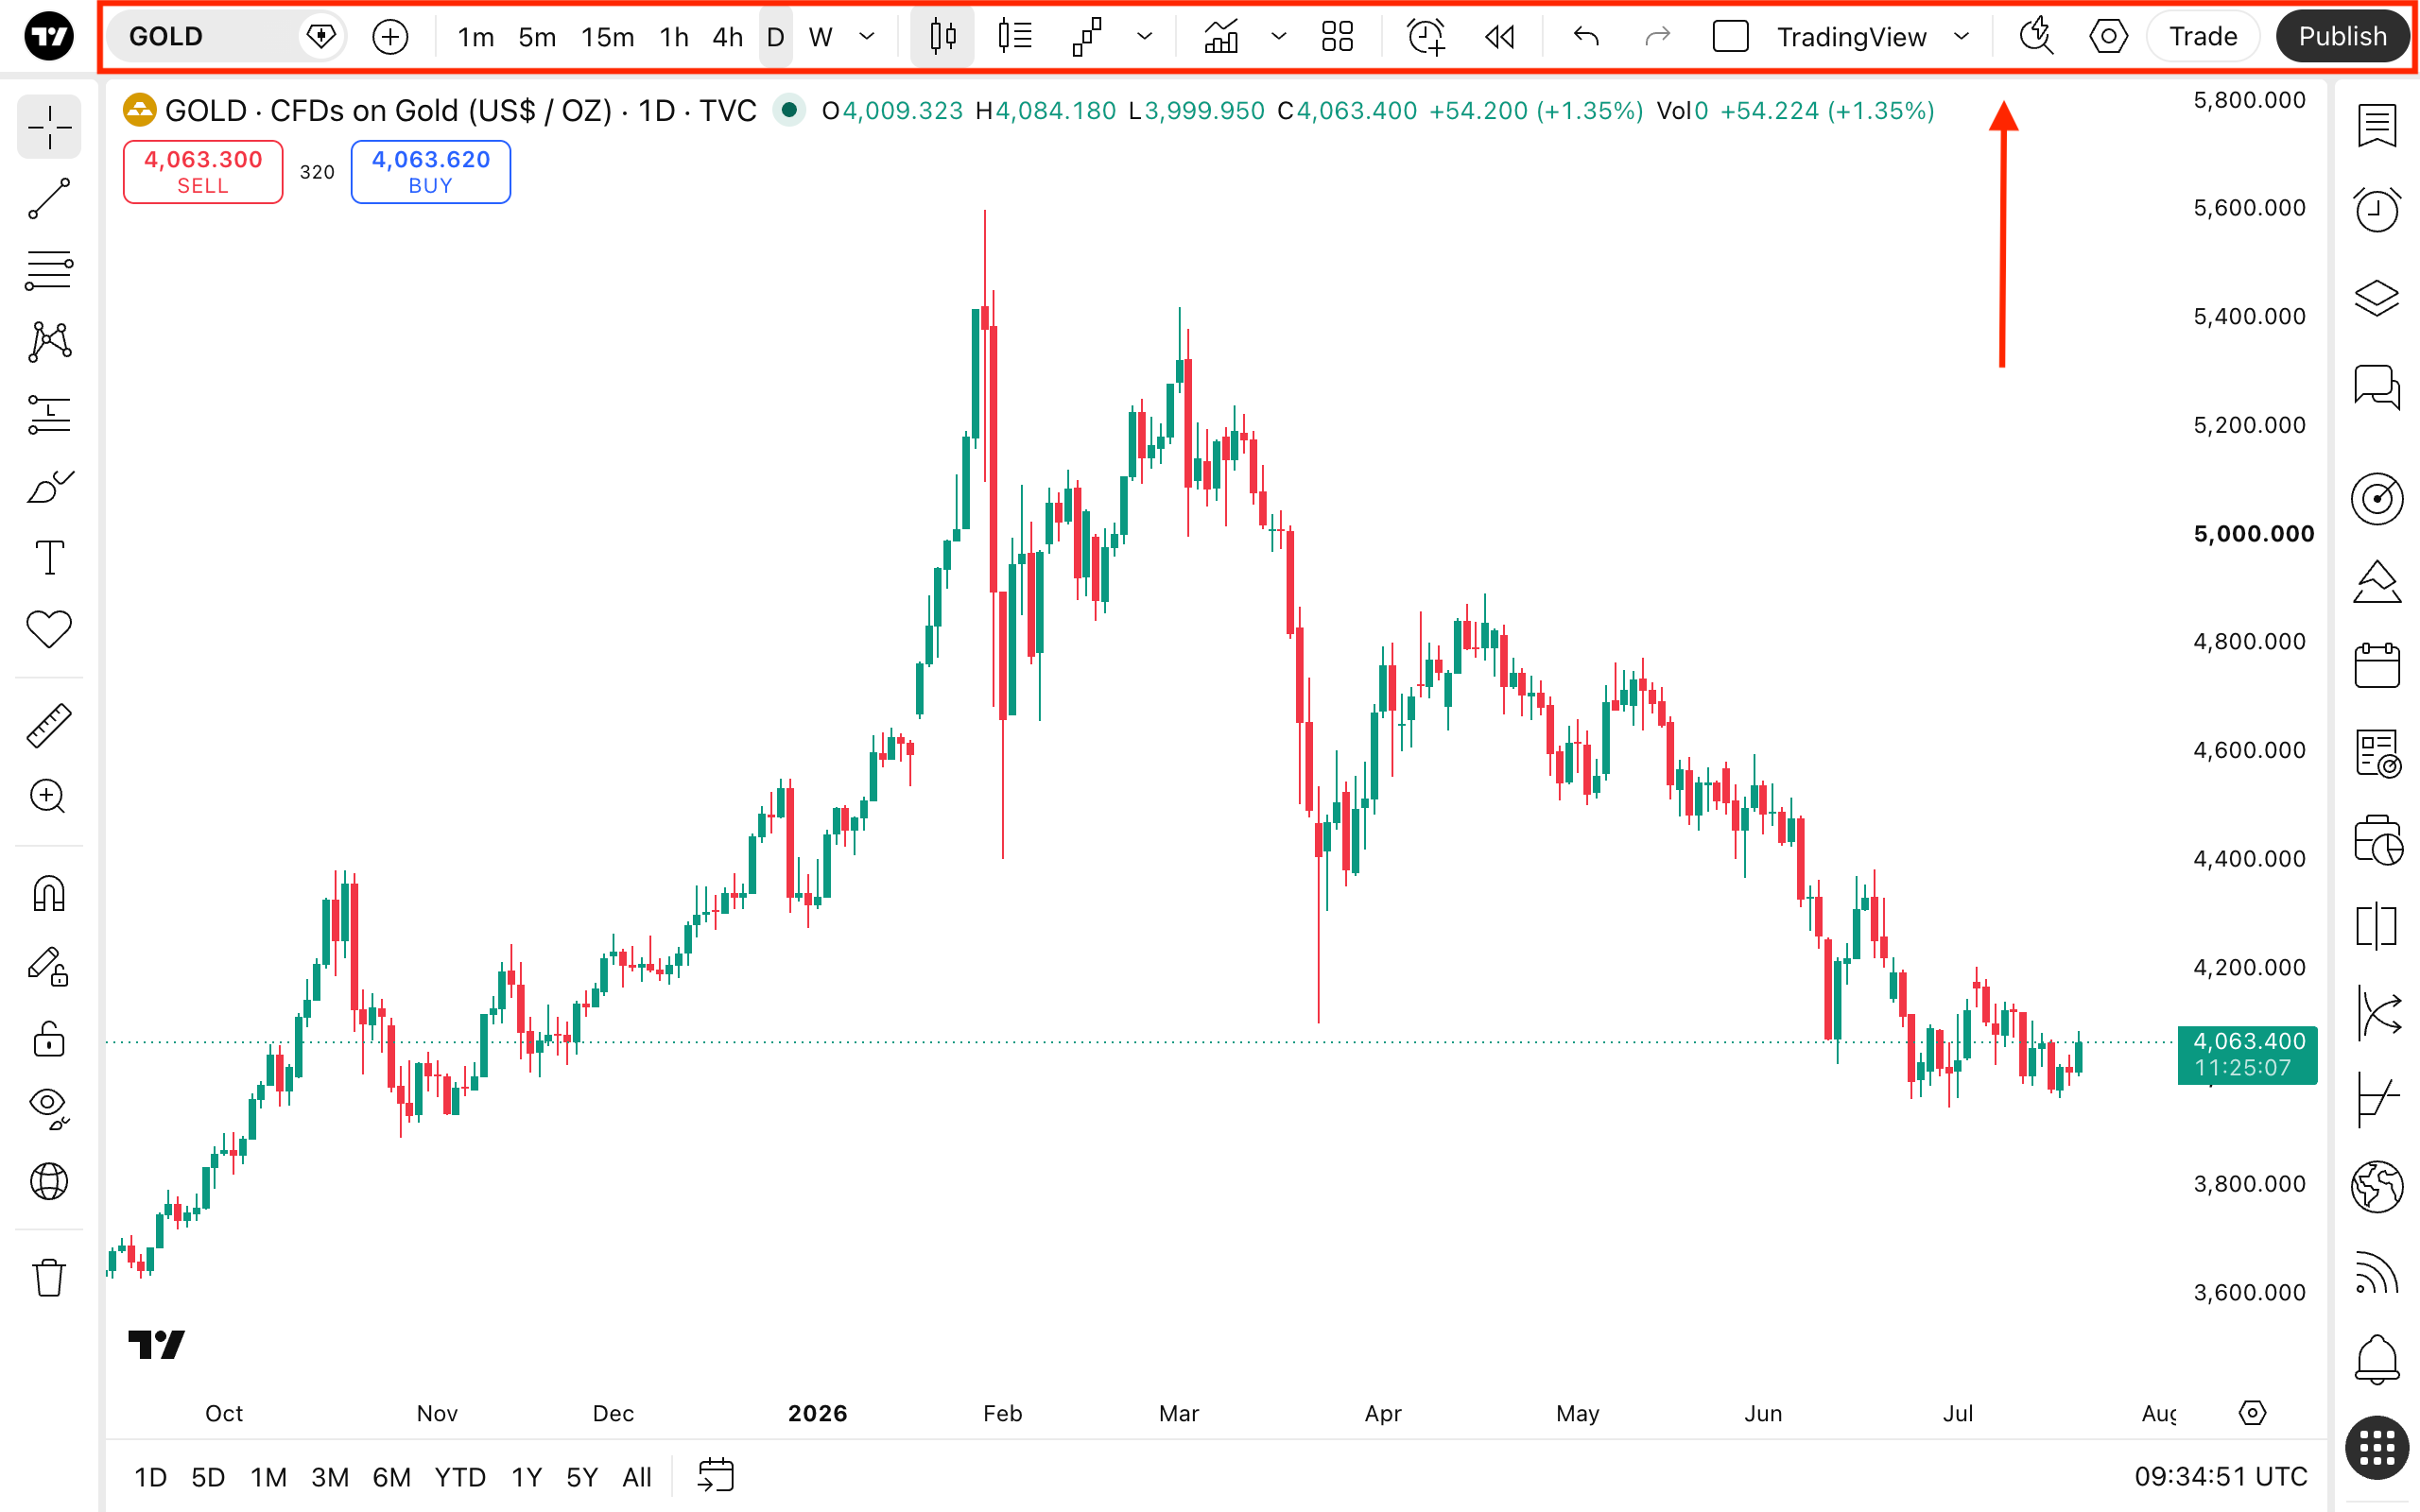
What is TradingView
TradingView is a cloud-based platform for market charts, analytics, watchlists, news, alerts, and custom scripts. The workspace is accessible via browser, desktop, and mobile apps. If a supported broker is connected, some users can place live orders directly from Supercharts.
The main difference from a specific broker's terminal is the wide selection of data sources and symbols. The same asset can exist on different exchanges, with different brokers and providers. Therefore, the first step is not to “add an indicator” but to verify the exact ticker and source.
Supercharts, several chart types, objects, indicators, news and financial data.
Watchlists, color flags, notes, scanners and alerts.
Paper Trading uses virtual funds and does not require a real deposit.
Connecting a licensed broker via Trade; features and orders depend on the integration.
Account and security
- Create an account on the official TradingView domain.
- Use a unique password and enable two-factor authentication.
- Check your email and recovery methods.
- Do not log in via links from messages about a “signal” or a “gift subscription”.
- If you are connecting a broker, verify the domain and the login window before entering any credentials.
A TradingView subscription and a brokerage account are paid for and serviced by different companies. A paid chart plan does not create a real account and does not automatically include market data from all venues.
Supercharts: workspace layout
| Region | Purpose |
|---|---|
| Top panel | Ticker, period, chart type, indicators, templates and layouts. |
| Left panel | Lines, channels, Fibonacci, text, measurements and other objects. |
| Right panel | Watchlist, alerts, symbol data, news and additional modules. |
| Bottom panel | Pine Editor, Strategy Report, Replay and the trading panel — depending on the mode and interface. |
| Scales | Price, time, scale settings and jump to level. |
How to correctly choose a ticker
Enter the name or code in Symbol Search, then look at the exchange or data provider to the right of the ticker. AAPL on NASDAQ, a CFD on Apple at the broker, and a synthetic instrument — are not the same. For Forex, EURUSD from different providers may have slight differences in quotes and sessions.
- The ticker corresponds to the desired asset.
- The exchange or data provider is chosen consciously.
- The quote currency is clear.
- The session and time zone fit your analysis.
- There is no data lag marker on the chart that you have not accounted for.
- In live trading, the symbol is available with the connected broker.
The chart and the trading panel can receive data from different sources. TradingView specifically warns: after connecting a real broker, the data in the ticket and the Buy/Sell buttons come from the broker. They may differ from the chart source.
Market data and latency
Some exchanges require a separate subscription for real-time data. The free or paid plan of the platform itself does not always include the exchange package. Check the Delayed, Real-time labels and the source next to the symbol.
For medium‑term analysis a small delay may be acceptable, but for an intraday order on a fast market it is critical. Before trading, compare the chart price, the broker's Bid/Ask, and the data in the order ticket.
Watchlists
A watchlist helps separate active instruments from general scanning. Add sections: indices, currencies, gold, cryptocurrencies, stocks, open positions, and candidates. Color flags can be used for status rather than as a buy signal.
- Create a new Watchlist.
- Add precise tickers along with the source.
- Split the list into thematic sections.
- Configure the displayed columns.
- Add a note with the reason for the observation.
- Delete instruments that have become outdated.
Layouts and synchronization
A Layout stores charts, settings, objects and indicators and has its own URL. Watchlists and alerts are not part of a specific layout. This is important when backing up and moving a workspace.
If multiple charts are used, configure synchronization of symbol, timeframe, crosshair, time and objects separately. Indicators are not required to appear automatically on every chart; they can be applied to the entire layout with the appropriate command.
Chart types and timeframes
Candles and bars show the actual OHLC of the selected source. Some special chart types transform the price and may hide the true path within the period. This is useful for analysis, but for backtesting and trading decisions you need to understand the construction method.
- Start with standard candles.
- Set the time zone and trading session.
- Compare the higher and working periods.
- Do not confuse the chart timeframe with the indicator's recalculation frequency.
- Use Bar Replay for training, understanding its limitations.
Charting tools
Trend lines, horizontal levels, channels, Fibonacci, rectangles, and text notes help formalize a scenario. An object can be anchored to price and time, hidden on specific periods, and saved in the layout.
To keep the chart from turning into an archive of old ideas, use a consistent color code and regularly delete outdated objects. Locking an object protects it from accidental movement.
Indicators and templates
TradingView offers built-in and public indicators. A public script can be open, protected, or invitation-only. Popularity does not guarantee quality.
- Open Indicators.
- Select a built-in indicator or carefully review the author and the script description.
- Check the Inputs, source, and period.
- Find out whether the indicator repaints past values.
- Save the working set as an Indicator Template.
- Do not use a signal without an independent risk rule.
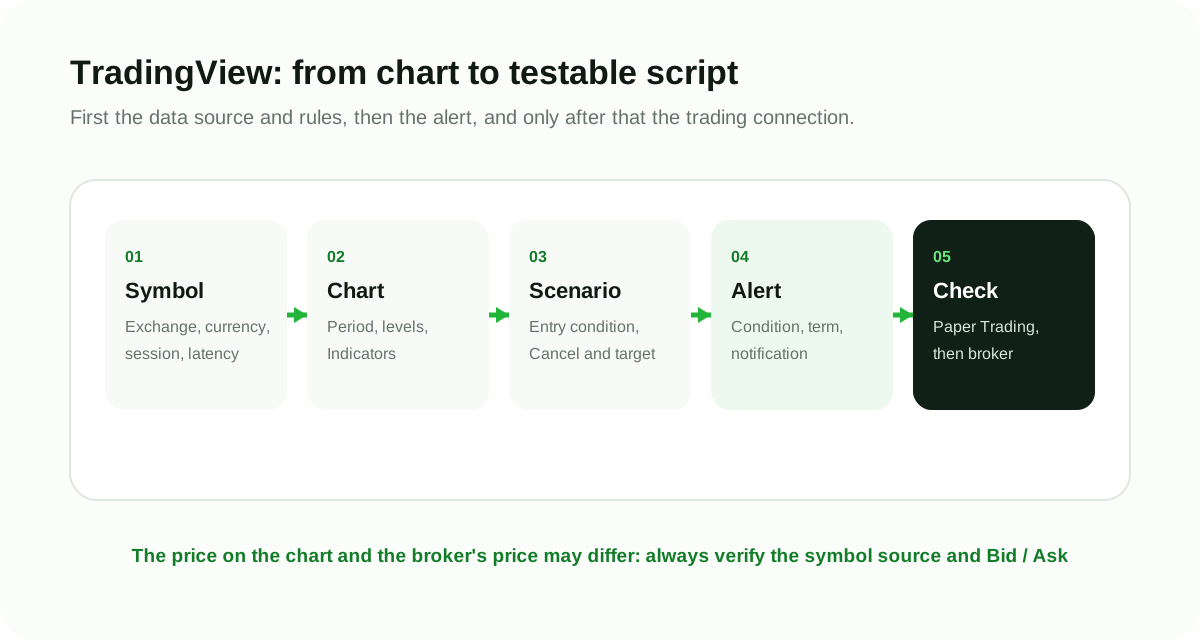
Alerts
An Alert can be created based on price, an indicator, a strategy, or a chart object. Indicator conditions depend on the timeframe. If you change the indicator parameters after creating the Alert, the existing Alert may continue to operate with the previous settings.
- The exact symbol and source are specified.
- The correct interval is selected.
- The condition is understood: once, crossing, greater/less or strategy event.
- The validity period is set.
- Notification tested.
- The webhook contains no secrets and is directed to a secure address.
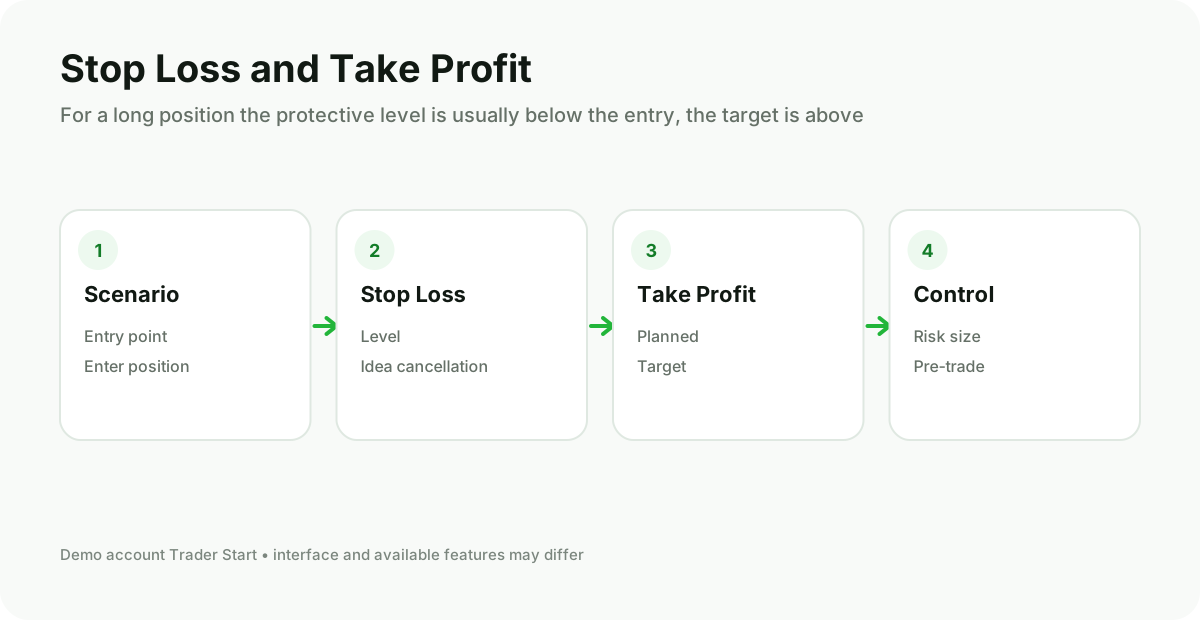
Paper Trading
Paper Trading — a built-in simulator with virtual funds. Open Supercharts, click Trade, select Paper Trading and connect. Then set the initial balance, currency and parameters if the interface offers it.
- Select a liquid symbol and a regular market session.
- Create Market, Limit, and Stop orders.
- Add S/L and T/P.
- Check positions, orders, and history.
- Save the entry reason log.
- Compare the planned and actual scenario.
The simulator does not fully reproduce liquidity, psychology, latency, and execution of a real account. Its purpose is to teach the process and test the rules, not to prove future profit.
Save the workspace and check Paper Trading
Open TradingView, save the layout, and place a demo order before connecting a live account.
Live trading requires a supported broker and a compatible account.
How to connect a broker
- Make sure the broker is supported in your country and for the required account type.
- Open a compatible account with the broker.
- In Supercharts, click Trade.
- Select the broker and complete its official authorization.
- Check Demo/Live, currency and account number.
- Match the symbol on the chart with the broker's symbol.
- Create a minimal demo order and locate it in the history.
Order ticket may support different order types depending on the broker. Do not copy the Paper Trading instruction verbatim to a live account without verifying the available fields.
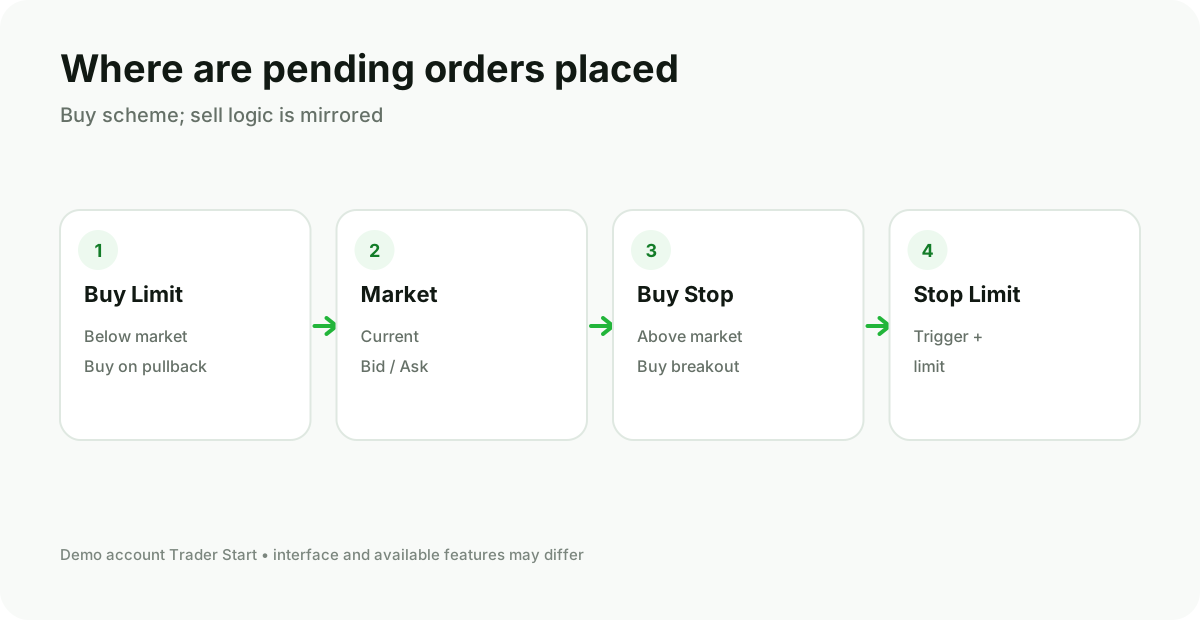
Orders in TradingView
After connecting Paper Trading or a broker, order tickets and chart trading become available. Market orders are filled at the available price, Limit orders cap the acceptable price, Stop orders activate after the level is reached. Specific order types and time-in-force depend on the integration.
When trading extended sessions, liquidity can be lower and volatility higher. Support for pre-market and after-hours trading depends on the instrument, exchange, and broker.
Pine Script, indicators and strategies
Pine Script is used for custom indicators, strategies, and libraries. The Pine Editor allows you to create, edit, and backtest scripts. An indicator displays calculations, a strategy generates model orders and a report.
- First, describe the rule in plain language.
- Separate the entry, exit, and position size conditions.
- Create a strategy, not an indicator, if you need a Strategy Report.
- Set commission, slippage, size, and initial capital.
- Check lookahead and the use of future data.
- Separate the optimization and testing period.
- Conduct a forward test via alerts or Paper Trading.
Important limitation: According to the official TradingView documentation, automatic execution of a Pine strategy directly on a broker account is not yet a native feature. The strategy works for backtesting; for external automation, alerts and custom integration are usually used, and the associated risks must be managed separately.
How to read the Strategy Report
Analyze net profit together with maximum drawdown, number of trades, profit factor, average trade, and stability over time. In the strategy settings you specify capital, currency, size, pyramiding, commission, slippage, margin, and the recalculation model.
- Commission and slippage are not zero without reason.
- The strategy does not use future data.
- The result persists on other instruments or timeframes if this is expected by the logic.
- A small change in parameters does not destroy the result.
- There is a separate verification period and Paper Trading.
Mobile app
TradingView Mobile is convenient for Watchlists, alerts, charts, and monitoring the linked account. Complex layout configuration and Pine development are easier to perform on a large screen. Before placing an order on the phone, verify the symbol source, account number, and volume.
Typical mistakes
| Error | Why it's dangerous |
|---|---|
| The wrong ticker was selected | A different exchange, currency, session or CFD provides a different chart. |
| No delay detected | The decision is made at an outdated price. |
| Too many indicators | The chart creates an illusion of confirmation, but the signals are duplicated. |
| Paper taken as a real model | Liquidity, emotions and actual execution are not accounted for. |
| Backtest without costs | The result is overstated. |
| A Pine strategy is considered a trading robot | A backtest by itself does not send orders to the broker |
| Live is connected instead of Demo | The demo order becomes a real trade |
TradingView at IC Markets
IC Markets officially describes the TradingView trading integration via cTrader. First, create a compatible account and check availability for your region. At Tickmill, the availability of TradingView may depend on the product, region, and legal entity — verify before registering.
Check account compatibility and risk warning before live trading.
Frequently Asked Questions
Is TradingView a broker?
No. It is an analytics and trading platform. The real account and execution are provided by a connected broker.
Can you use TradingView for free?
There is a basic access, while extended limits and features depend on the current pricing plans. Individual real-time exchange data may require an additional fee.
Why does the price differ from MT5?
Most likely a different data provider, symbol, session, or Bid/Ask is being used. Compare the chart source with the broker's quotes.
Is it possible to trade a Pine strategy automatically?
The official documentation states that the strategy is intended for backtesting and direct automated execution on a broker account is not yet available as a native feature.
Which is better: TradingView or MT5?
TradingView is especially strong in cloud charts, data, and alerts; MT5 is a full-featured broker terminal with MQL5 and a desktop tester. Many traders use both tools together.
Do you need to pay for data?
It depends on the exchange and the required latency. Check the status of the specific symbol and the data package terms.